
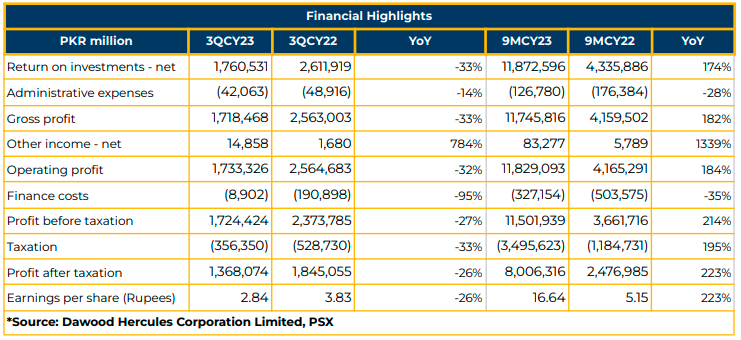
In 9MCY23, Dawood Hercules Corporation Limited (DAWH) reported a standalone net profit of PKR 8.00 billion (EPS: PKR 16.64), a significant increase from PKR2.48 billion (EPS: PKR 5.15) in the same period last year (SPLY).
The net return on investment surged by 174% YoY to PKR 11.87 billion in 9MCY23, compared to PKR 4.34 billion in the corresponding period of the previous year. Gross Profit also experienced a substantial YoY increase, reaching PKR 11.75 billion in 9MCY23, up from PKR 4.16 billion in SPLY, representing a growth of 182%.
Operating profit reached PKR 11.83 billion in 9MCY23, a notable increase from PKR 4.17 billion in the corresponding period last year. Other income saw a significant rise to PKR 83.28 million, compared to PKR 5.79 million in SPLY.
Administrative expenses decreased by 28% YoY to PKR 126.78 million, while finance costs witnessed a 35% YoY decrease to PKR 327.15 million in 9MCY23.
The Profit Before Tax (PBT) for 9MCY23 increased by 214% YoY to PKR 11.51 billion, compared to PKR 3.66 billion in SPLY.
The current portfolio of the company includes a strategic investment of PKR 51.50 billion in ENGRO, listed equity investment of PKR 6.61 billion, and mutual fund investment of PKR 469 million.
Dividend income from ENGRO increased by 79% YoY to PKR 9.22 billion in 9MCY23, compared to PKR 5.15 billion in SPLY. Dividends from other sources also increased by 50% YoY to PKR 1.21 billion. Unrealized gains on quoted shares registered a substantial increase of 232% YoY to PKR 2.4 billion, compared to a loss of PKR 1.82 billion in SPLY. Gain on mutual funds amounted to PKR 10 million.
However, realized loss on quoted shares significantly increased to PKR 984 million, compared to PKR 32 million in the previous year. Similarly, interest income decreased by 93% YoY to PKR 15 million in 9MCY23, compared to PKR 229 million in SPLY.
In 9MCY23, DH Portfolio outperformed the KSE-100 index with a net return of 33.9%, compared to 14.4% for KSE-100. On a Holding Period Return (HPR) basis, DH Portfolio outperformed its peers in the active funds category: DH Portfolio 37.1%, ABL Stock 16.7%, Alfalah GHP 12.6%, Lakson Equity Fund 3.8%, NI(U)T (-5%), HBL Stock Fund (-17.5%).
A similar trend was observed on a CYTD basis, with DH Portfolio outperforming most of its peers: DH Portfolio 32.5%, ABL Stock 16.6%, HBL Stock Fund 15.5%, Alfalah GHP 15%, Lakson Equity Fund 11.1%, and NI(U)T (-6.9%).
On an HPR basis, DH Portfolio largely outperformed its peers in the aggressive funds category: DH Portfolio 37.1%, UBL Stock Adv Fund 27.7%, AKD Opportunity Fund 24.7%, NBP Stock Fund 19%, MCB Pak Stock Market Fund 9.4%, JS Large Cap Fund 1%, Faysal Stock Fund (-7.2%).
Likewise, on a CYTD basis, DH Portfolio outperformed almost all of its peers: DH Portfolio 32.5%, UBL Stock Adv Fund 17.1%, AKD Opportunity Fund (-3.3%), NBP Stock Fund 17%, MCB Pak Stock Market Fund 15.9%, JS Large Cap Fund 13.2%, Faysal Stock Fund (-18.4%).
The sectoral mix in DH equity market core portfolio consists of 64% banks, 18% others, 9% IT, and 9% E&P in CY23. The investment strategy focuses on dollar-hedged stocks, primarily in banks, with a gradual increase of the IT sector in the portfolio mix. The textile and power sectors are no longer part of the portfolio due to low margins and higher volatility.
Going forward, DWAH aims to surpass this year’s dividend in the coming year, and the management anticipates higher profits in the upcoming year.
Important Disclosures
Disclaimer: This report has been prepared by Chase Securities Pakistan (Private) Limited and is provided for information purposes only. Under no circumstances, this is to be used or considered as an offer to sell or solicitation or any offer to buy. While reasonable care has been taken to ensure that the information contained in this report is not untrue or misleading at the time of its publication, Chase Securities makes no representation as to its accuracy or completeness and it should not be relied upon as such. From time to time, Chase Securities and/or any of its officers or directors may, as permitted by applicable laws, have a position, or otherwise be interested in any transaction, in any securities directly or indirectly subject of this report Chase Securities as a firm may have business relationships, including investment banking relationships with the companies referred to in this report This report is provided only for the information of professional advisers who are expected to make their own investment decisions without undue reliance on this report and Chase Securities accepts no responsibility whatsoever for any direct or indirect consequential loss arising from any use of this report or its contents At the same time, it should be noted that investments in capital markets are also subject to market risks This report may not be reproduced, distributed or published by any recipient for any purpose.