Live KSE 100 Heat map - PSX Heatmap: Unlock Superior Returns
In the dynamic world of capital markets, understanding data visualizations is crucial. One such potent visualization tool that has made waves in the investment sector is the stock heatmap. Chase Securities is proud to present its dedicated page showcasing the real-time PSX Heatmap or the KSE 100 Heatmap.
PSX Heat Map: The Complete Market Overview
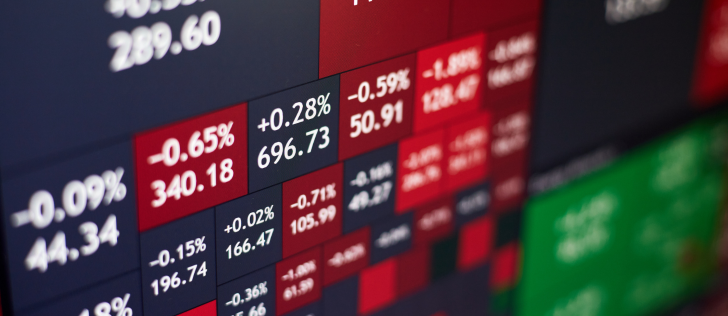
Unlike conventional heatmaps that group stocks by sectors, our PSX Heatmap offers a holistic view, presenting every listed company without sectorial divisions. This design choice fosters a broader perspective, allowing investors to spot overarching market trends and anomalies more swiftly. Furthermore, the color parameter is intricately tied to the daily PSX performance. As a result, with just a glance, users can gauge the day’s market sentiment, discerning whether the trading landscape is dominated by bullish green or bearish red hues. It’s a streamlined, intuitive tool designed for clarity and rapid insights in the ever-evolving world of the Pakistan Stock Exchange.
Sector-Specific Insight with Our PSX Heatmap
When you’re navigating the diverse terrain of the PSX, there’s a lot to consider. Whether you’re tracking the momentum of Modarabas, diving into the intricacies of Cable & Electrical Goods, or following the latest in Technology & Communication, our heatmap offers clarity. From the sweet dynamics of Sugar & Allied Industries to the robust foundations of Cement and Property, from the ever-reliable Commercial Banks to the energizing world of Power Generation & Distribution – we’ve got it all covered.
Whether it’s the craftsmanship in Leather & Tanneries, the innovative strides in Automobile Assembler, or the environmental concerns in Fertilizer, our sector-based view gives you a ringside seat. Curious about Transport, Pharmaceuticals, or even Jute? Want to explore Textile, be it Composite, Weaving, or Spinning? They’re all there. And that’s just scratching the surface. With segments ranging from Oil & Gas in its various forms to Food & Personal Care Products, and from specialized areas like Real Estate Investment Trust to the broad spectrum of Miscellaneous companies, our heatmap ensures you don’t miss a beat in any sector.
Chase Securities has partnered with TradingView for its charting technology. A global trading and investing platform providing exceptional charting experience, global market data and analytical tools like Stock Screener and Economic Calendar.
What is a Stock Heatmap?
A stock heatmap provides a graphical representation of the financial market’s activity. At its core, it’s designed to give investors a quick overview of what’s happening in the market, highlighting areas of interest or concern. Using color-coded systems, the heatmap displays which stocks are performing well and which aren’t, based on specific criteria such as price movement or trading volume.
The heatmap stands out due to its intuitive design. The human brain is wired to understand and process visual information faster than textual data. As such, stock heatmaps have become an essential tool for traders and investors to rapidly absorb vast amounts of market data.
Why PSX Heatmap?
The Pakistan Stock Exchange (PSX) is one of the pivotal financial hubs in South Asia, reflecting the economic pulse of the nation. Given its dynamic nature and vast array of listed companies, understanding the ebb and flow of the market can be challenging.
The PSX Heatmap bridges this gap. It acts as a visual guide, allowing both novice and seasoned investors to immediately gauge market sentiment, identify potential opportunities, and discern key trends. In a market as vibrant and volatile as the PSX, having a heatmap is not just an advantage—it’s a necessity.
By providing a consolidated, color-coded view of the entire market’s performance, the PSX Heatmap by Chase Securities offers investors clarity in a complex financial landscape, empowering them to make more informed decisions.
They condense vast troves of data into digestible formats, ensuring investors don’t miss the forest for the trees. As markets continue to
grow in complexity, tools like our heatmap will play an even more pivotal role, guiding stakeholders through the labyrinthine world of
stocks and securities.
Holistic Market Understanding Without Sectorial Bias
Traditional heatmaps often classify and group stocks by their respective sectors. While this approach has its merits, it can inadvertently lead to a tunnel vision, making investors fixate on specific industries and possibly overlook emerging opportunities or threats in others. By presenting each listed company without any sectorial divisions, our KSE100 Heatmap encourages investors to develop a panoramic market view.
This broader perspective can be crucial, especially in a diversified market like the PSX, where cross-sectorial trends and correlations often hold the key to superior investment strategies.
Tailored for Varied Audiences
The PSX Heatmap isn’t just for institutional investors or seasoned market professionals. Its intuitive design and emphasis on daily performance make it equally beneficial for individual investors, educators, and even students of finance. For those new to the stock market, it provides an accessible entry point, demystifying complex market movements. Educators can leverage it as a teaching tool, illustrating real-world market dynamics in classrooms or online tutorials.
Benefit from Our Expert Research Team
At Chase Securities, our strength lies not only in cutting-edge tools like the PSX Heatmap but also in the unmatched expertise of our dedicated research team. With decades of experience under their belts, our analysts bring deep market knowledge and insights, honed over years of navigating the intricacies of the Pakistan Stock Exchange.
Understanding the market is one thing, but crafting a personalized investment strategy that aligns with your unique needs is another. Whether you’re contemplating your investment journey, evaluating your current portfolio, or seeking to understand the implications of market trends, our team stands ready to guide you.
We take into account vital factors such as your investment horizon, risk appetite, and return expectations to ensure your financial strategies are robust, resilient, and tailored to your aspirations.
Ready to embark on a more informed and rewarding investment journey?
To discuss your financial roadmap and learn how our insights can benefit you, reach out to us at +922135293051 or fill the contact us form below.
FAQs
A stock heatmap is a graphical representation of market activity, showcasing which stocks are performing well and which aren’t based on criteria like price movement or trading volume.
ypically, warmer colors like red indicate a decline in stock prices, while cooler colors like green indicate a rise. However, always refer to the legend provided with the heatmap.
Brightness or intensity of the color can show the magnitude of a stock’s movement. Bright shades might indicate significant price shifts, while muted ones could represent lesser volatility.
The area represents the volume or liquidity of a stock. Larger segments signify stocks with higher trading volumes, possibly making them more attractive for trading.
Heatmaps offer a quick overview of the market, revealing patterns, investment opportunities, and liquidity distribution. They condense vast amounts of data into an easily digestible format.