
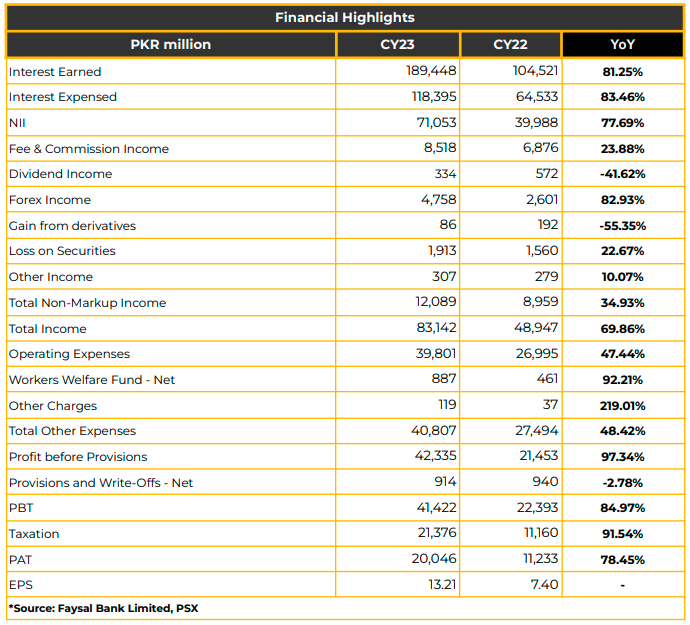
In CY23, FABL reported a record profit of PKR 20.05 billion (EPS: PKR 13.21), marking a 78.5% YoY increase from PKR 11.23 billion (EPS: PKR 7.40) in the corresponding period last year.
The growth in PAT would have reached 84% without a tax on windfall income, amounting to PKR 622 million. Net Interest Income (NIMs) surged by 77.7% to PKR 71.05 billion in CY23, driven by an 81.3% YoY increase in interest earnings (PKR 189.45 billion).
Non-markup income rose by 34.9% to PKR 12.09 billion, driven by fee commission income (PKR 8.52 billion), foreign currency dealing (PKR 4.76 billion), and dividend income (PKR 334.06 million). The home remittances market share improved to 4.5%, and transaction volume increased by 30% YoY in CY23.
Total income increased by 69.9%, resulting in an improved cost-to-income ratio of 49% in CY23 versus 56% last year. The infection ratio stands at 3.8%, lower than the industry in CY23.
On a consolidated basis, the bank’s PBT increased to PKR 41.85 billion, with profit after tax standing at PKR 20.25 billion, surpassing PKR 11.44 billion in the same period last year. This increase was attributed to robust growth in current accounts and NII.
Total deposits and net advances grew by 30% (PKR 1 trillion) and 28% (PKR 581 billion), respectively, with an ADR standing at 57.03%. FABL’s market share in deposits is at 3.7%. Management reasoned that the relatively younger branches produced lower average deposits per branch.
The deposit mix comprises 60% for the private sector, 16% for NBFIs, 1% for banking institutions, 2% for public sector entities, 3% for the government, and 18% for individuals.
The bank registered growth in Increase CA by PKR 49 billion, SA by PKR 89 billion, and TD by PKR 98 billion. Ijara Sukuk Bonds increased by PKR 135 billion during the year, partially offset by the disposal of PIBs amounting to PKR 14 billion in CY23. Investments in Ijara
Sukuk with floating rates amount to 12% of the total investment.
Commodity financing significantly increased and was reported at PKR 84 billion. The bank also witnessed growth in OMO borrowings by PKR 45 billion, partially offset by a decrease in Interbank Borrowings by PKR 22 billion. Management shared that the repo borrowing of PKR 5 billion also got settled due to the disposal of PIBs.
The bank reported higher provisions due to impairment on the equity securities book in 1HCY23 (PKR 1.3 billion) and specific provisions because of FSV benefit withdrawal (PKR 1.1 billion).
Segment-wise advances stood at 76% for CIBG, 22% for retail, and 1% for others during CY23. The yield on investments was reported at 19% in CY23.
Strong current deposit momentum continued, reaching PKR 326 billion (18% YoY up). CASA mix stands at 75% versus 80% due to growth in term deposits.
The CAR, ROA, and ROE stood at 17.46%, 1.6%, and 25% in CY23. The bank’s operating expenses increased by 47.4% YoY to PKR 39.8 billion, driven by investments in human resources, technology, and higher inflation.
FABL operates 722 branches and aims to achieve a target of 850 branches by the end of this financial year. The bank also introduced a new branded account, Amal, for women. Moreover, 50,000 new customers using Noor cards were added in CY23.
The bank witnessed 80% growth in traffic migration to digital channels during the said period.
Going forward, FABL plans to focus on low-cost CASA deposits, driving volumes from large corporations, driving new business growth from smaller corporates and SMEs, consumer financing, and branch focus while maintaining a healthy CAR.
Additionally, management aims to target an improved CASA ratio and market share with a cautious lending strategy to maintain low NPL levels. Management expects ADR taxation to impact the deposit mobilization of the bank.
The management also anticipates a high level of interest rates in the current financial year.
Important Disclosures
Disclaimer: This report has been prepared by Chase Securities Pakistan (Private) Limited and is provided for information purposes only. Under no circumstances, this is to be used or considered as an offer to sell or solicitation or any offer to buy. While reasonable care has been taken to ensure that the information contained in this report is not untrue or misleading at the time of its publication, Chase Securities makes no representation as to its accuracy or completeness and it should not be relied upon as such. From time to time, Chase Securities and/or any of its officers or directors may, as permitted by applicable laws, have a position, or otherwise be interested in any transaction, in any securities directly or indirectly subject of this report Chase Securities as a firm may have business relationships, including investment banking relationships with the companies referred to in this report This report is provided only for the information of professional advisers who are expected to make their own investment decisions without undue reliance on this report and Chase Securities accepts no responsibility whatsoever for any direct or
indirect consequential loss arising from any use of this report or its contents At the same time, it should be noted that investments in capital markets are also subject to market risks This report may not be reproduced, distributed or published by any recipient for any purpose.