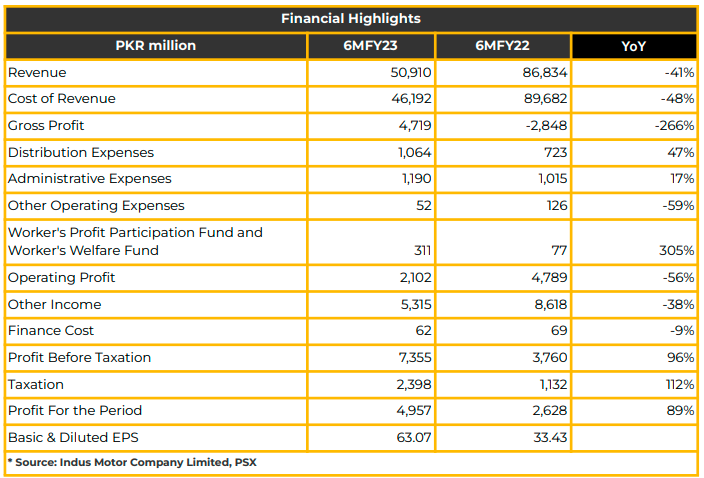
In 6MFY24, Indus Motor Company Limited (INDU) reported a net profitability of PKR 4.96 billion (EPS: PKR 63.07), reflecting an 89% YoY increase from PKR 2.63 billion (EPS: PKR 33.43) in the corresponding period of the previous year. Management highlighted that the impact of sales taxes was not passed on to customers last year, thereby reducing the company’s profitability.
During 2QFY24, the management noted stability in exchange rate in Pakistan. However, demand contraction occurred in the second quarter due to year-end phenomena.
The Company’s unit sales in 6MFY24 were 7,324, marking a 61% YoY decrease from 18,672 units sold in SPLY. Similarly, INDU produced 6,391 units in 6MFY24, a 66% YoY decline from 18,562 units in SPLY.
The company’s top line dropped by 41% YoY, reaching PKR 50.91 billion, with a positive gross profit of PKR 4.72 billion. The decline in turnover was attributed to lower CKD and CBU sales volumes. The market share of the Company is 16%. The drop in production and sales was attributed to sluggish demand and supply chain disruptions.
Regarding localization, board approved a PKR 3 billion investment, with more than half of the localization of Corolla and other vehicles already achieved.
Management stated that they are currently in discussions with the government regarding the export of specific service parts, automotive leather, labor, and fuel vehicles to African countries.
In 6MFY23, the management reported a 40% YoY contraction in the auto industry due to higher duties and taxes (50% for vehicles above 2000cc), higher interest rates, low auto finance availability, and diminished consumer purchasing power. Consequently, the net sales of the Company decreased to PKR 14.54 billion in FY23 compared to PKR 24.27 billion in SPLY.
The import of used cars was reported at 16,580 units in 6MFY24 compared to 6,583 units in SPLY, with the highest import of 3,301 units in November 2023.
The market for economy passenger cars declined by 34%, 43% for small Low HB, 56% for Sedan, while the market for luxury pessenger cars increased by 11% in 6MFY24.
The market for Light Commercial Vehicles (LCV) declined by 28%, with 1-Ton PU declining by 51%, SUV by 27%, Vans by 4%, and Trucks & buses by 56%. The sale of used PC and used CV increased by 823% and 549% in 6MFY24.
Competitors in the industry enjoyed higher margins due to the Automotive Development Policy, allowing them duty-free import of plant and machinery, as per management.
Cost of sales declined by 48% YoY to PKR 46.19 billion in 6MFY24 compared to PKR 89.68 billion in SPLY. In December 2023, the company launched the Toyota Corolla Cross with the highest localized content for hybrid vehicles in the entire auto market, aiming to reduce fuel imports and promote a cleaner environment.
Distribution costs increased by 47% YoY to PKR 1.06 billion in 6MFY24 from PKR 722.81 million in SPLY due to the introduction of the first locally manufactured cross hybrid electric vehicle (HEV). Administration expenses increased by 17% YoY to PKR 1.19 billion during the same period.
The finance cost of the company decreased by 9% YoY to PKR 22.32 million in 6MFY24, compared to PKR 68.73 million in SPLY.
The recent plant shutdown is a one-off event, as there are no supply-chain and import restrictions.
Looking ahead, the management anticipates the auto sector to remain under pressure in FY24 and FY25.
Furthermore, the normalization of the import of used cars, due to the relaxation of duties and taxes, is a cause for concern for the auto industry. INDU urges the government to formulate consistent policies regarding Hybrid incentives and rationalize the taxation system on CKD vehicles to support volumetric growth.
Important Disclosures
Disclaimer: This report has been prepared by Chase Securities Pakistan (Private) Limited and is provided for information purposes only. Under no circumstances, this is to be used or considered as an offer to sell or solicitation or any offer to buy. While reasonable care has been taken to ensure that the information contained in this report is not untrue or misleading at the time of its publication, Chase Securities makes no representation as to its accuracy or completeness and it should not be relied upon as such. From time to time, Chase Securities and/or any of its officers or directors may, as permitted by applicable laws, have a position, or otherwise be interested in any transaction, in any securities directly or indirectly subject of this report Chase Securities as a firm may have business relationships, including investment banking relationships with the companies referred to in this report This report is provided only for the information of professional advisers who are expected to make their own investment decisions without undue reliance on this report and Chase Securities accepts no responsibility whatsoever for any direct or indirect consequential loss arising from any use of this report or its contents At the same time, it should be noted that investments in capital markets are also subject to market risks This report may not be reproduced, distributed or published by any recipient for any purpose.